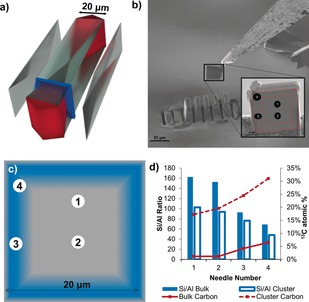
Figure 5.

a) Expanded view 3D schematic of a large zeolite ZSM‐5 crystal showing the internal architecture of the material, which is composed of several distinct subunits, as well as the location of the removed cross‐section (blue panel) prepared by Focused Ion Beam (FIB) milling. b) The cross‐section that was removed for APT needle preparation. The red dashed lines show the locations of the subunits and the black numbered circles indicate the needle locations. c) Schematic representation of Al zoning in the zeolite ZSM‐5 cross‐section; blue represents regions with higher Al content and approximate needle positions are numbered 1 to 4. d) Bulk and cluster Si/Al ratio and 13C atomic % plotted for APT needles 1 to 4. Clusters are defined as groups of closely spaced 13C atoms and the cluster Si/Al ratio is inside the volume occupied by the clusters, averaged over all clusters in each needle. Adapted from Ref. 70.
