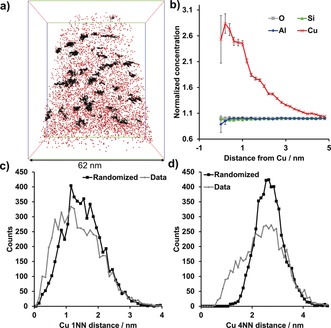
Figure 6.

APT analysis of a fresh (calcined) zeolite Cu‐SSZ‐13. a) 3D map of all Cu ions in the needle, with Cu clusters shown in black. Bounding box dimensions of 70×62×62 nm3. b) Cu radial distribution function (RDF) showing a clear Cu–Cu affinity, but no significant affinity for any other species. c,d) Cu nearest neighbor distributions (NNDs) for the first (c) and fourth (d) nearest Cu neighbor in fresh Cu‐SSZ‐13 demonstrating that using a higher order NND can decrease noise in the analysis. Adapted from Ref. 64.
