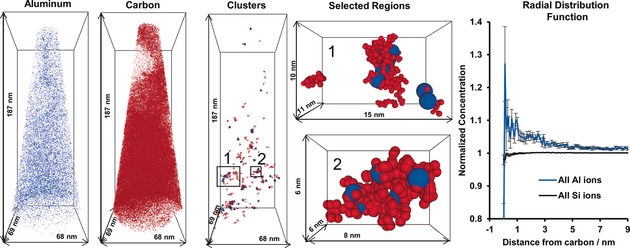
Figure 9.

Overview of the analysis applied to a coked zeolite ZSM‐5 crystal after contacting it with 13C‐labeled methanol at 623 K for 90 minutes. The distributions of all Al (blue) and 13C (red) atoms in the needle are shown next to the carbon clusters. Two selected regions are expanded to show the association between coke and Al atoms (note Al atom sizes have been exaggerated for clarity). The radial distribution function shows an elevated Al content near coke carbon. Adapted from Ref. 70.
