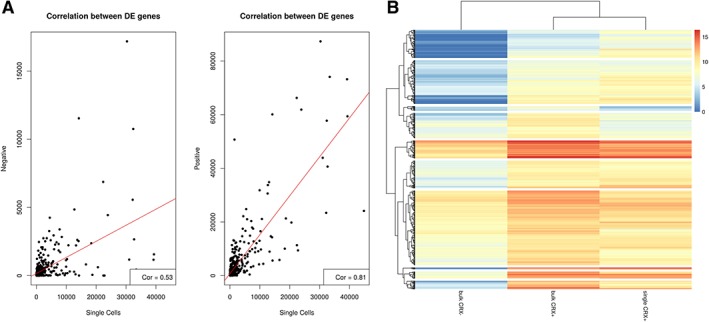
Figure 1.

Correlation between bulk and single cell RNA‐seq analyses. (A): Correlation between bulk RNA‐Seq of CRX− (left panel) and CRX+ (right panel) and single cell RNA‐Seq of CRX+ using the Pearson correlation test. (B): Comparative heatmap showing differentially expressed genes between bulk RNA‐Seq of CRX+ and CRX− cells and single cell RNA‐seq of CRX+ cells.
