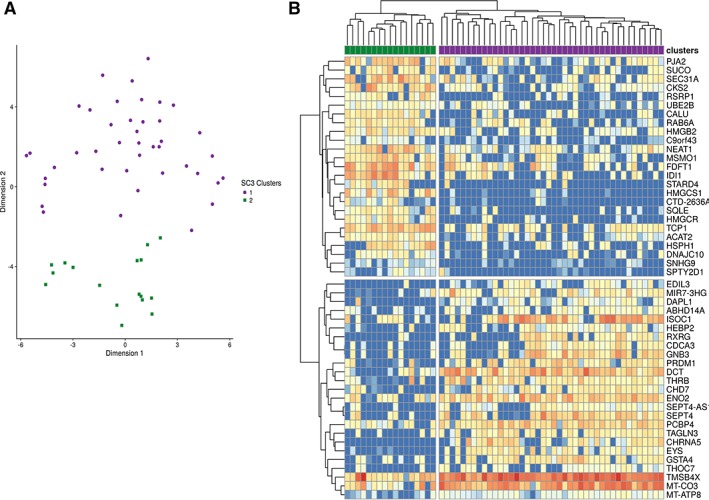
Figure 2.

SC3 clustering analysis reveals two clusters within the CRX+ cells. (A): A predominant cluster containing 72% of cells (purple) and a smaller cluster containing 28% of cells (green) revealed by single cell RNA‐Seq of CRX+ cells. (B): Heatmap showing the 25 most differentially expressed genes between the two clusters within the CRX+ population.
