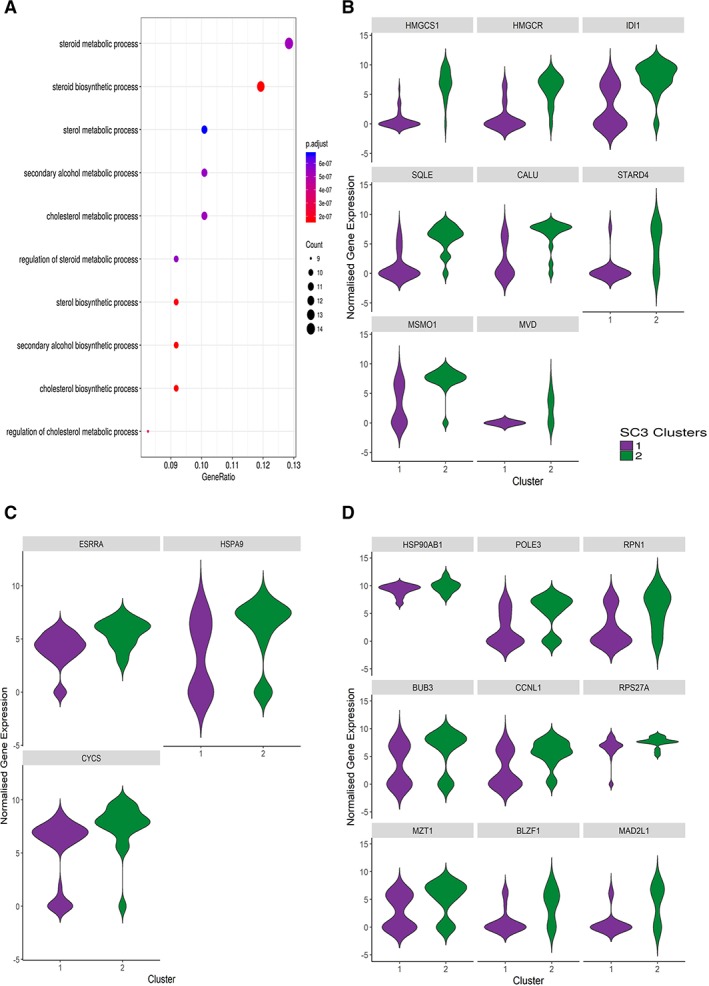
Figure 4.

Cluster 2 shows enrichment of genes involved in cholesterol/lipid metabolism, mitochondrial biogenesis and mitotic genes. (A): Pathway analysis of genes enriched in cluster 2 showing the cholesterol and lipid metabolism to be the predominant pathways. (B): Violin plot analysis showing higher expression of genes involved in cholesterol/lipid metabolism genes in cluster 2 compared with cluster 1 CRX+ cells. (C): Violin plot analysis showing higher expression of genes involved in mitochondrial biogenesis in cluster 2 compared with cluster 1 CRX+ cells. (D): Violin plot analysis showing higher expression of genes involved in mitosis genes in cluster 2 compared with cluster 1 CRX+ cells.
