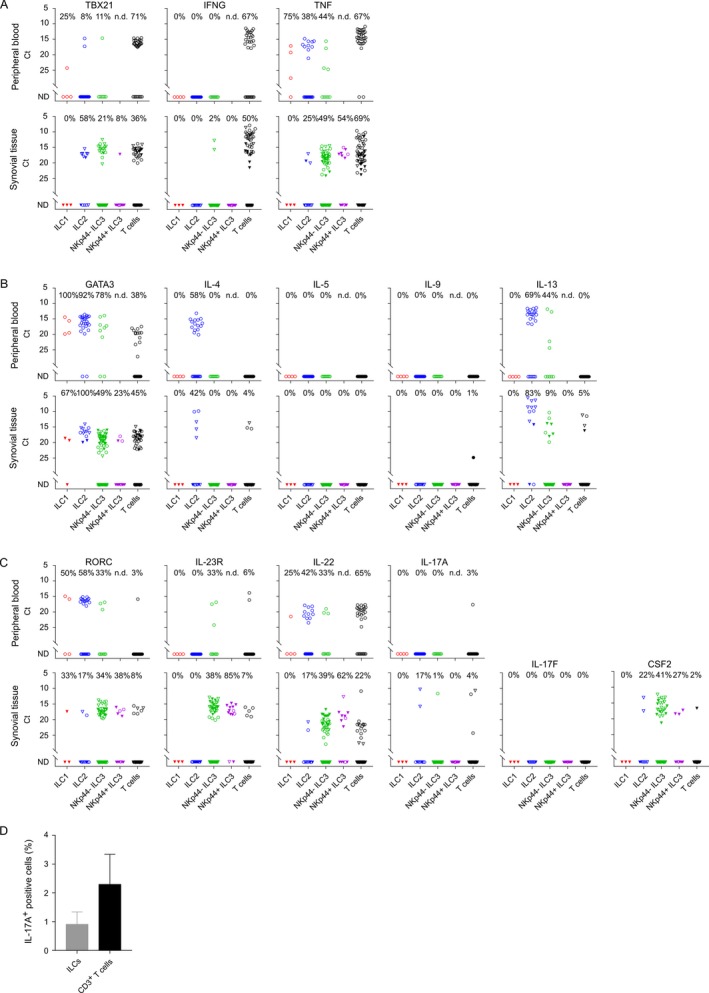
Figure 5.

A–C, Single‐cell expression profiling for transcripts specific for Th1 (A), Th2 (B), and Th17 (C) signature genes in phorbol myristate acetate (PMA)/ionomycin–stimulated innate lymphoid cells (ILCs) (ILC1, ILC2, and NKp44− and NKp44+ ILC3) and T cells isolated from spondyloarthritis (SpA) patient peripheral blood (n = 1) and synovial tissue (n = 2). Symbols represent single cells; cells from the first patient are represented by circles, and cells from the second patient by triangles. Open symbols represent cells stimulated with PMA/ionomycin alone; closed symbols represent cells stimulated with an interleukin‐1β (IL‐1β)/IL‐23 cytokine cocktail prior to stimulation with PMA/ionomycin. D, IL‐17A protein produced by PMA/ionomycin–stimulated ILCs and T cells isolated from SpA patient synovial fluid (n = 3) and analyzed by enzyme‐linked immunospot assay. Values are the median and interquartile range. ND = not detectable. Color figure can be viewed in the online issue, which is available at http://onlinelibrary.wiley.com/doi/10.1002/art.40736/abstract.
