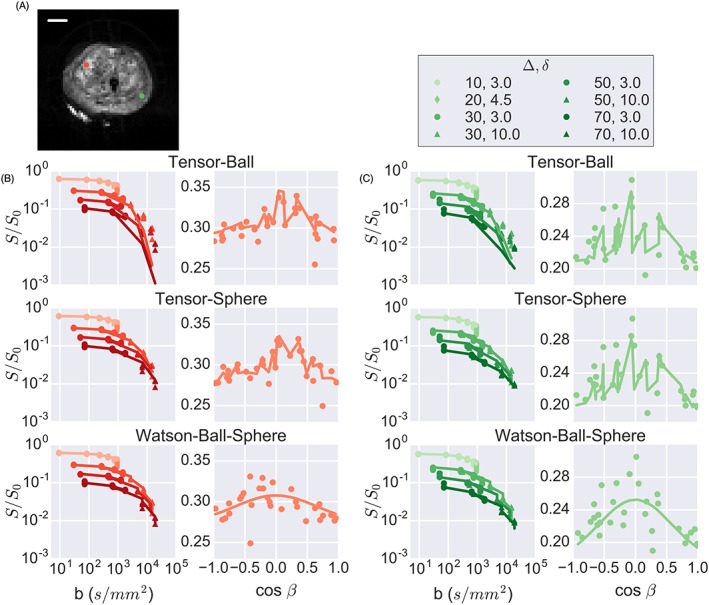
Figure 1.

Model fitting results. A, diffusion‐weighted imaging indicating two points with high (red) and low (green) SNR. B, fits to the data from the high‐SNR voxel for three models (see supplementary figure 2 for remaining fits) indicating that tensor‐sphere and Watson‐ball‐sphere capture the effects of restriction at high b‐values while tensor‐ball and tensor‐sphere better capture the variation with gradient direction. Signal is plotted versus cos β, where β is the angle between the primary diffusion direction and the gradient direction. Plots for tensors are not smooth because the signal also depends on the secondary diffusion direction. C, fits for the lower‐SNR voxel show similar trends as in B, but with less deviation at high b‐values for the tensor‐ball model and more signal dependence on gradient direction. The scale bar is 10 mm
