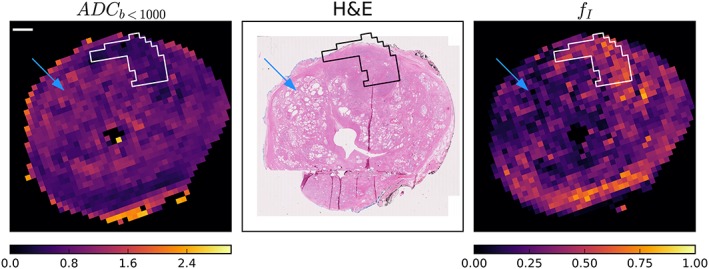
Figure 4.

Representative ADCb < 1000 and f I maps with registered H&E slice. The tumour region is in white on MRI and black on histology. Regions with substantial lumen space (blue arrows) correspond to regions with higher ADCb < 1000 and lower f I in the MRI maps. However, ADCb < 1000 and f I were also related to cell fraction, most clearly seen in the tumour regions, but in this case also near the bottom of the peripheral zone. Other specimen comparisons can be seen in supplementary figure 6. The scale bar is 10 mm
