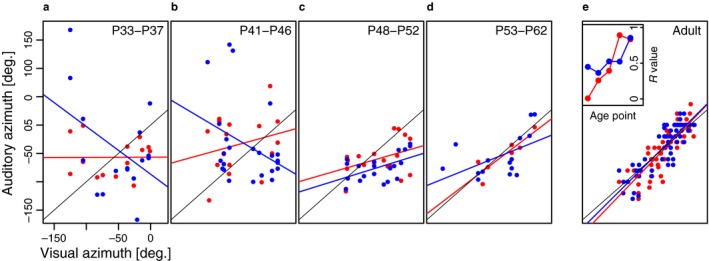
Figure 1.

Maturation of auditory spatial topography in the ferret SC. (a–e) Each panel plots the auditory best azimuth of deep layer SC units as a function of the visual best azimuth of multiunit activity recorded in the overlying superficial layers. The data were obtained at the postnatal ages indicated at the top of each panel using free‐field stimuli. Because adult‐like visual topography is present in the superficial SC layers throughout this developmental period, the topographic order of the auditory map is reflected in the degree to which it is in register with the visual map. Auditory responses recorded at near‐threshold sound levels (approximately 10 dB > unit threshold) are shown in red and suprathreshold levels (approximately 25 dB > unit threshold) in blue. A linear regression was fitted to the data from each sound level at each age group (red and blue lines; the black line is the 45° diagonal indicating perfect alignment of the visual and auditory data). The inset panel in (e) plots the correlation coefficient (R) of each regression slope as a function of age. At both sound levels, there is a steady increase in the R value during development, indicating an improvement in topographic order in the auditory representation. From Campbell et al. (2008) with permission.
