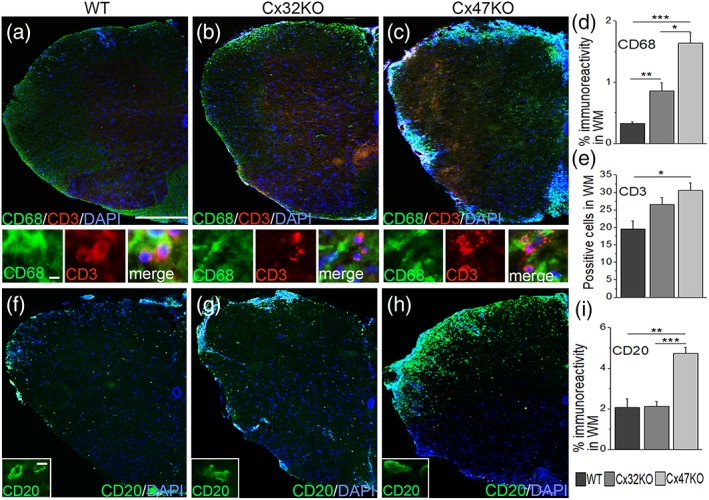
Figure 5.

Assessment of immune cells in WM of connexin mutant EAE mice. Representative images of lumbar spinal cord hemisections from 24 dpi WT, Cx32KO, and Cx47KO EAE mice as indicated (merged overview images and higher magnification images with separate channels underneath) double stained with macrophage marker CD68 (green) and T‐cell marker CD3 (red) (a–c), or stained with B‐cell marker CD20 (green) (f–h). Cell nuclei are visualized with DAPI (blue). Inflammatory cell infiltrates appear more pronounced in Cx47KO mice. D. Quantitative analysis reveals that macrophage immunoreactivity (% WM with CD68 immunoreactivity) is higher in mice lacking either Cx32 or Cx47 compared with the WT group, as well as in Cx47KO compared with Cx32KO mice. e. The mean number of CD3+ positive cells (n = 3 mice per group) was also higher in Cx47KO than in WT mice. (i) Quantification of CD20+ cells (% WM with CD20 immunoreactivity) revealed that B‐cell infiltrates were more extensive in Cx47KO compared with WT mice (n = 3 per group) data in (d), (e), and (i) represent mean ± SEM; Student's t‐test with Bonferroni correction and statistical threshold adjusted to 0.0167; *p < .025; **p < .01; ***p < .001; only statistically significant differences are shown). Scale bars: In a = 100 μm; in insets (a, f) =5 μm
