
Figure 5.
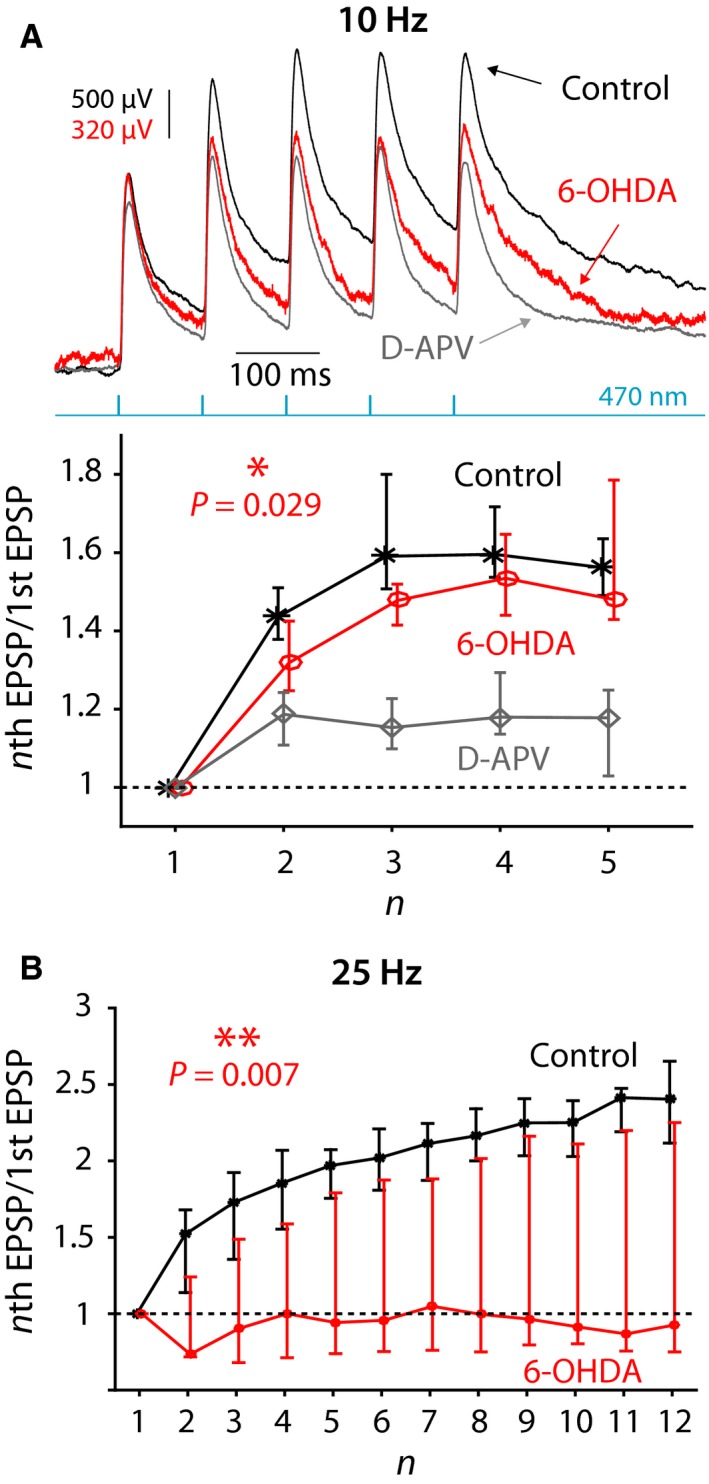
Synaptic integration at PfN synapses onto ChIs is degraded following 6‐OHDA treatment. (A) Top: Synaptic integration at PfN synapses onto ChIs in response to five 470‐nm pulses at 10 Hz in a control mouse before (black) and after (gray) application of D‐APV and in 6‐OHDA‐lesioned mouse (red). Note the difference in scale between the red vs. the other traces chosen so as to align the amplitude of the first EPSP. Bottom: Ratio of the amplitude of nth EPSP to the 1st EPSP in control mice before (black) and after (gray) application of D‐APV and in 6‐OHDA‐lesioned mice (red). (B) Same as in panel B, bottom, except that 12 pulses are given at 25 Hz. The curves in panels B and C depict medians and confidence intervals given by the 50%× (1 ± 1/√k) quantiles, where k is the sample size (Lasser‐Katz et al., 2017).