Figure 2.

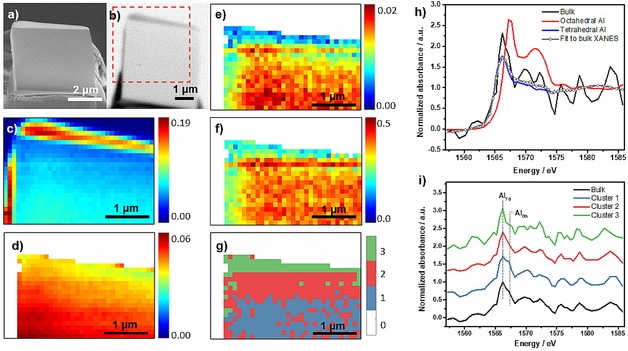
(a) Scanning electron microscope (SEM) image of the cross section mounted for the Scanning Transmission X‐ray Microscopy (STXM) experiment. (b) Transmission image of the entire cross section recorded at 1561.0 eV. The red rectangle indicates the scanning area in STXM, which was collected with a field of view (FOV) of 4×4 μm2 or 80×80 pixels (pixel size: 50×50 nm2). Area shown in figure c‐g is part of the scanning region that was designated for STXM‐XANES analysis with a FOV of 3.4×2.4 μm2 or 34×24 pixels (pixel size 100×100 nm2, binning 0.5). (c) STXM optical density of the cross section at 1566.2 eV, which was converted from the as‐recorded transmission image, showing the maximum absorption contrast. The scale bar indicates the X‐ray absorption intensity. (d) Average STXM optical density of the cross section in pre‐edge region after applying a mask to remove all data except the crystal, showing the thickness difference within the crystal. The scale bar indicates the absorption intensity of X‐rays. (e) Edge‐jump map based on XANES representing Al amount. The scale bar reports the values of the absorption edge jump, defined as the difference between the average intensity value in the XANES post‐edge region and the average intensity value in the XANES pre‐edge region. (f) Thickness‐corrected edge jump map based on XANES representing Al concentration. The scale bar indicates the absorption intensity of X‐ray. (g) The result of segmentation based on PCA and clustering analysis of the cross section showing the spatial distribution of the three clusters, with XANES for each cluster in (i). (h) Linear combination fitting of XANES of the bulk employing zeolite ZSM‐5 and α‐Al2O3 as reference for tetrahedral Al and octahedral Al, respectively. (i) Bulk XANES for the entire cross section along with the XANES for the three clusters isolated by PCA and clustering analysis.
