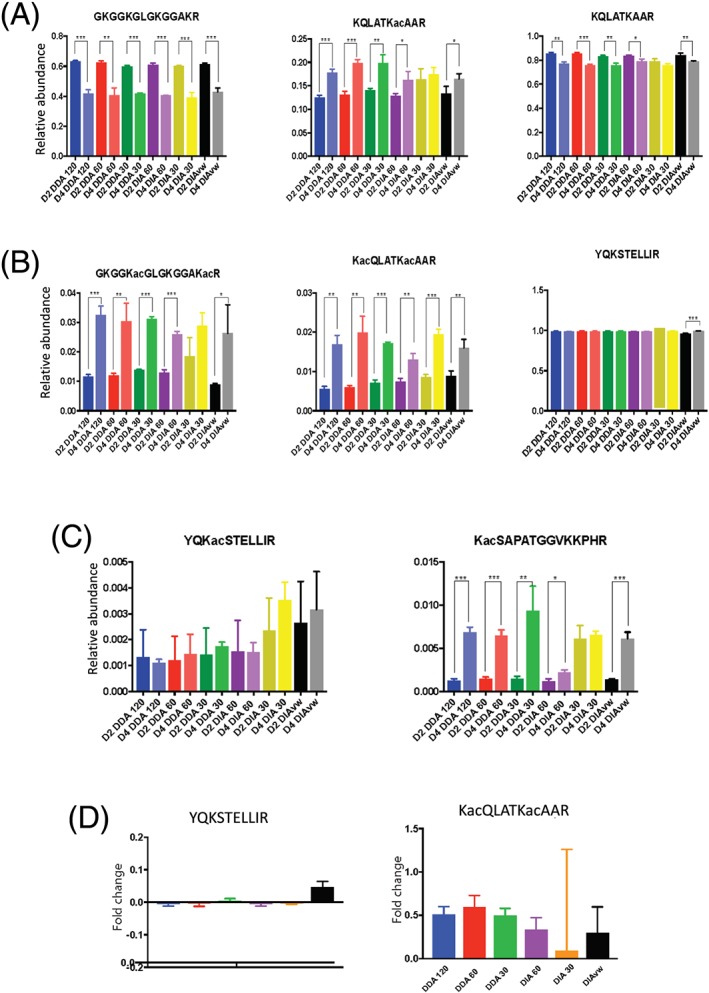
Figure 2.

Comparison of relative abundance of histone PTMs between data‐acquisition methods. The relative abundances of histone PTMs for day 2 and day 4 CHO cells were calculated using EpiProfile 2.0 for the different data‐acquisition methods. A, Histone peptide proteoforms with high MS1 intensity GKGGKGLGKGGAKR on histone H4, KQLATKacAAR and the unmodified form on histone H3. B, Three peptide proteoforms with medium MS1 signal intensities. GKGGKacGLGKGGKacR and KacQLATKacAAR represent lower relative abundance peptide proteoforms for the respective peptides and YQSTELLIR represents high relative abundance. C, Peptide proteoforms of both low relative abundance and low MS1 intensity. D. Fold change between the relative abundance of PTM for day 2 and day 4 for the peptide YQSTELLIR and the peptide KacQLATKacAAR (two‐tailed unpaired t test, * p <0.05, ** p <0.01, *** p <0.001). The 95% confidence intervals from the unpaired t tests are shown in Table S3 (supporting information) [Color figure can be viewed at wileyonlinelibrary.com]
