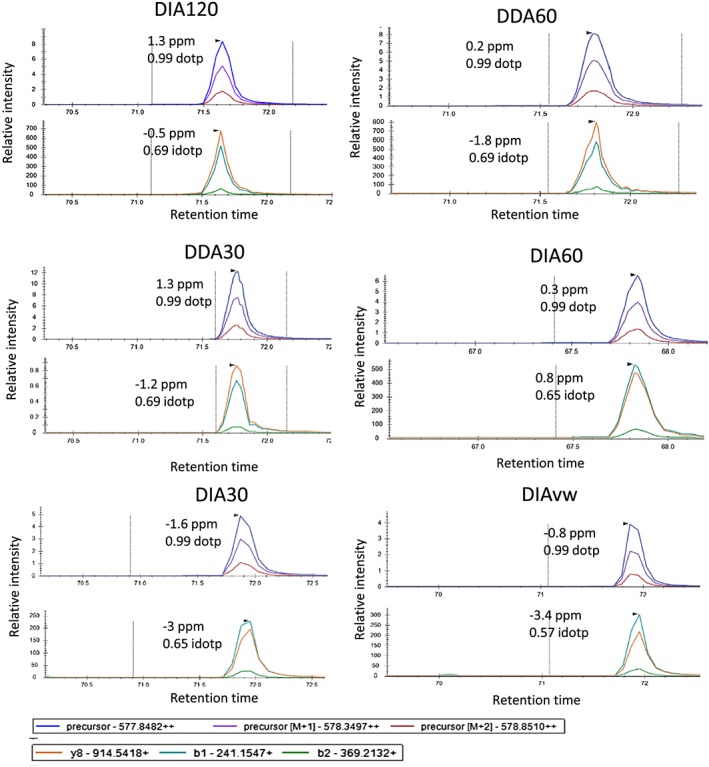
Figure 4.

Representative extracted ion chromatograms for the peptide KQLATKAAR in each data‐acquisition method with ppm error for MS1 and MS2 spectra and the dotp (isotope dot product which is a comparison between the observed and theoretical isotope distributions) and idotp (dot product which compares the observed spectra and spectral library match) scores. This shows that they are of similar quality [Color figure can be viewed at wileyonlinelibrary.com]
