
Figure 2.
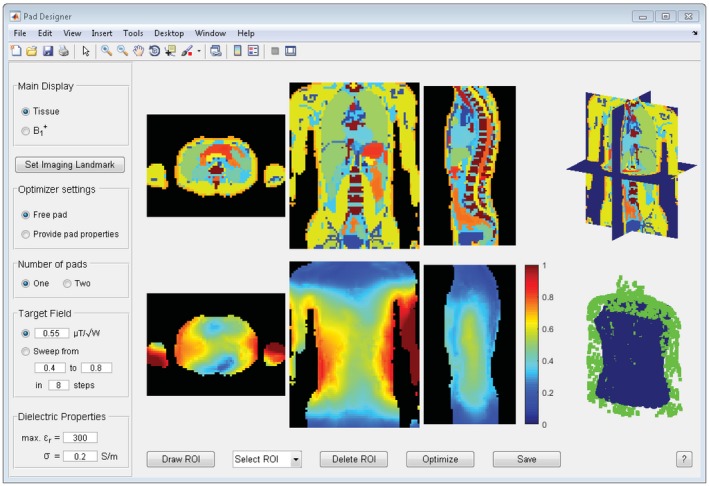
Graphical user interface of the pad design tool. Tissue profiles are shown in the top row, whereas B 1 + fields are depicted in the bottom row. After a ROI is drawn, the user can start the optimization with the selected options
Official websites use .gov
A
.gov website belongs to an official
government organization in the United States.
Secure .gov websites use HTTPS
A lock (
) or https:// means you've safely
connected to the .gov website. Share sensitive
information only on official, secure websites.
Graphical user interface of the pad design tool. Tissue profiles are shown in the top row, whereas B 1 + fields are depicted in the bottom row. After a ROI is drawn, the user can start the optimization with the selected options