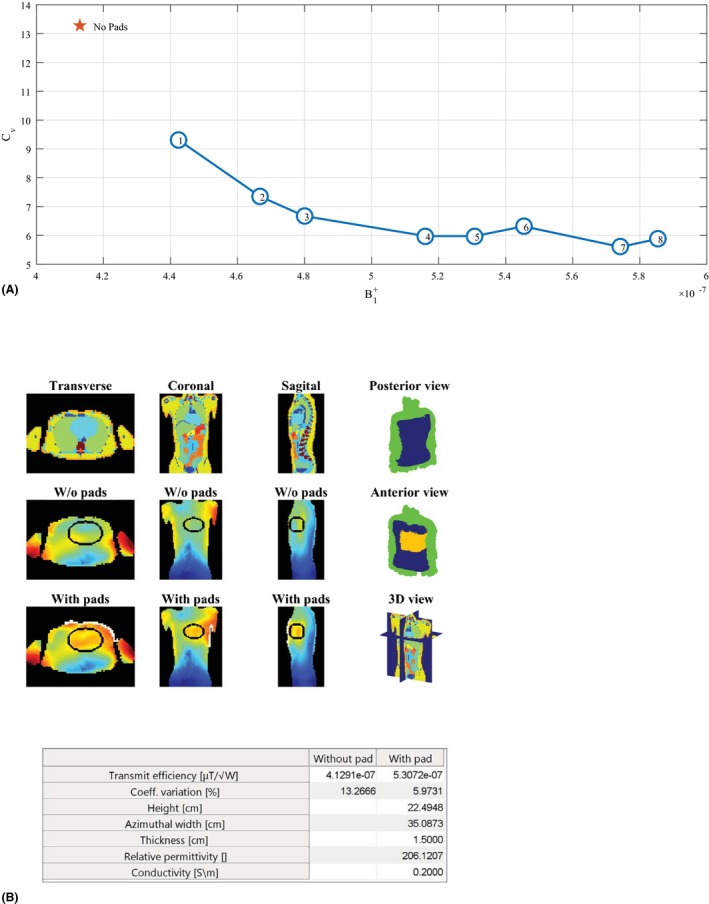
Figure 4.

Design procedure for imaging the heart at 3T. A, The result is shown for a parameter sweep over a predefined set of target fields, after which a desired design can be selected based on the efficiency‐homogeneity plot. For the selected design (here, number 5), a single optimization is performed to obtain the results as shown in (B) for later reference. Design number 7 is not chosen here, as the dimensions of the dielectric pad are not practical. The lookup table for the individual simulations can be found in Supporting Information Table S1
