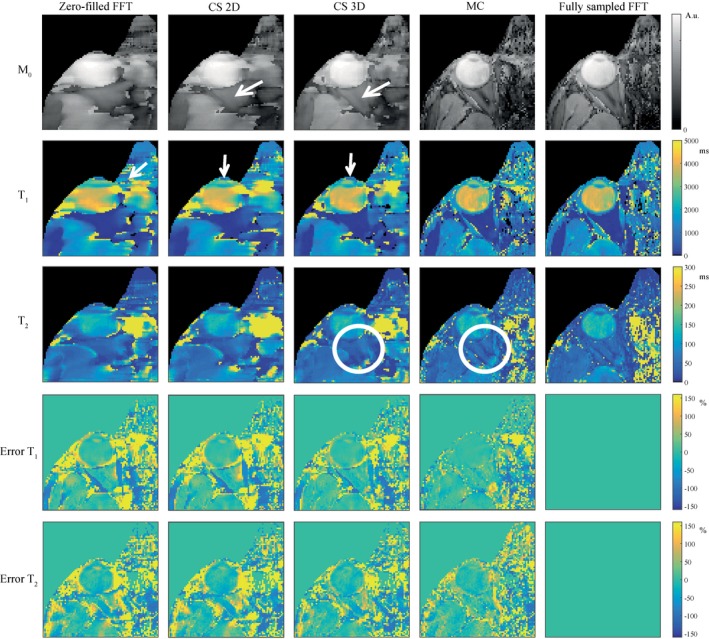
Figure 2.

Simulated effect of different reconstruction methods on the parameter maps. Columns 1 to 4 show parameter maps after reconstruction of subsampled source images using a zero‐filled FFT, CS with spatial regularization (2D), CS with spatial and temporal regularization (3D), and MC. Column 5 shows parameter maps after an FFT of the fully sampled data. Adding the temporal regularization in the 3D CS reconstruction improves the quality of the parameter maps (M0, T1, T2) compared with the zero‐filled FFT and the 2D CS reconstruction (see white arrows). The parameter maps resulting from an MC‐based reconstruction show more detail (see white circles), much smaller errors, and the errors have a more noise‐like structure. Note that all M0 maps are shown on a log‐scale due to the high dynamic range of the tissue proton densities
