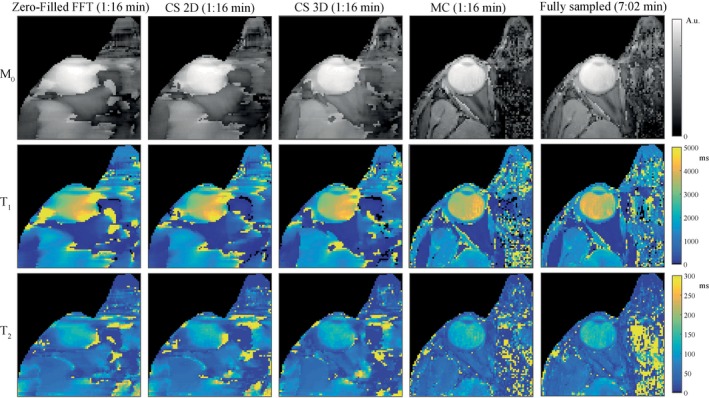
Figure 3.

The effect of different reconstruction methods on the parameter maps of experimental data at low resolution. Parameter maps obtained at low (1.0 × 1.0 × 5.0 mm3) resolution confirm the findings from the simulation (c.f., Figure 2). The parameter maps obtained from a CS reconstruction show loss of detail. The quality of the maps obtained from the undersampled scan after an MC‐based reconstruction is comparable to the quality of the maps from a fully sampled scan. Inhomogeneities are visible in the vitreous body, which is very hard to accurately encode due to the low sensitivity of the MRF train for very long T1 values
