
Figure 4.
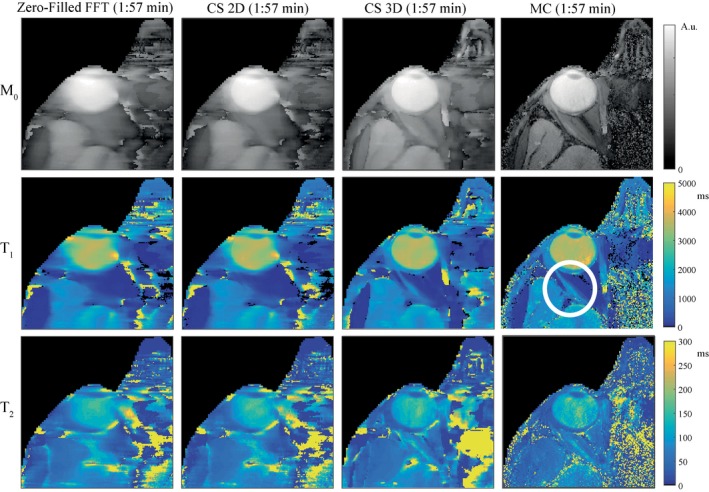
The effect of different reconstruction methods on the parameter maps of experimental data at high resolution. Parameter maps obtained at high (0.5 × 0.5 × 5.0 mm3) resolution for the same subject as in Figure 3 show more structural detail, indicated by the white circle. Note that Figure 3 and Figure 4 were different scans, in which motion artifacts are also different. Fully sampled data sets were not acquired for the high resolution case due to the prohibitively long scanning times required