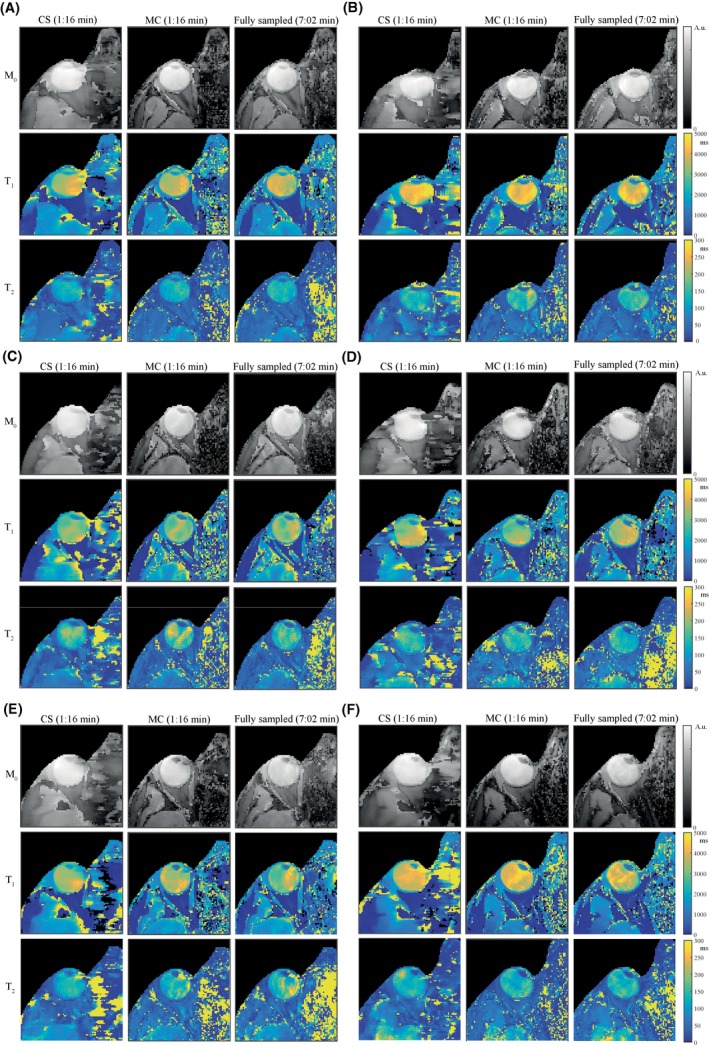
Figure 5.

The parameter maps in all healthy volunteers. Parameter maps, resulting from low resolution scans, obtained in 6 healthy volunteers are shown in (A‐F), respectively. In all volunteers, the parameter maps obtained from a CS reconstruction (3D CS) show loss of detail compared with the maps obtained from the undersampled scan after an MC‐based reconstruction, for which the quality is comparable to that of the fully sampled scan: values are given in Table 1. In some volunteers the inhomogeneities in the vitreous body appear stronger than in others, which probably correspond with cases of more motion. This can also be seen in (E,F), where the quality of the maps is better for the shorter scans (MC) compared with the fully sampled ones
