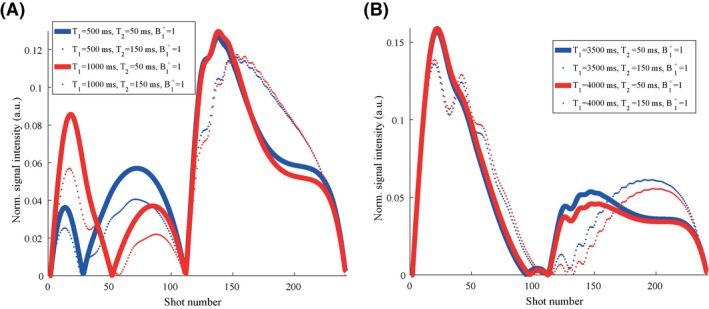
Figure 6.

Simulated dictionary elements for different relaxation times. A, The simulated normalized absolute signal intensities for tissues with a T1 of 500 ms (blue) is plotted together with the signal evolution for tissues with a T1 of 1000 ms (red). Solid lines show simulation results for T2 values of 50 ms, while dotted lines show results for T2 values of 150 ms. Comparison of the red and blue graphs shows that the difference in T1 is encoded mostly in the first half of the MRF sequence, whereas T2 is encoded over the entire train. Comparison of the solid and dotted graphs shows that the second half helps to further encode differences in T2. B, The same results are plotted for a T1 of 3500 ms (blue) and 4000 ms (red), showing much smaller differences between the 2 simulated signal evolutions for the same absolute difference in relaxation times. This indicates that a certain difference in T1 is easier detected for lower T1 values with the current MRF train. Optimization of the MRF train might increase the encoding capability for large T1 values. For all simulations the B1 + fraction was set to 1
