
Figure 7.
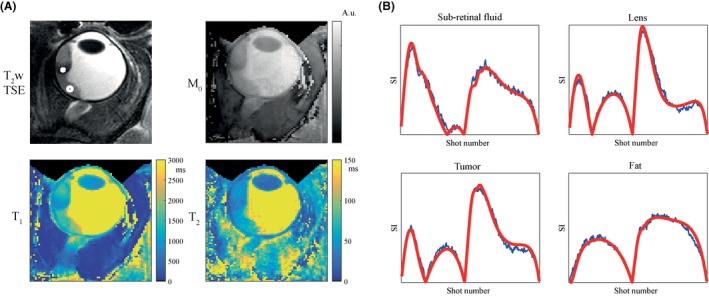
Parameter maps and matches in a uveal melanoma patient. A, T2‐weighted turbo spin‐echo (TSE) images with fat suppression (SPIR) were obtained and shown (zoomed‐in) for reference, with scan parameters: FOV = 40 × 60 mm2; in‐plane resolution 0.5 mm2; 2 mm slice thickness; 10 slices; TE/TR/TSE factor = 62 ms/3000 ms/12; FA = 110°; refocusing angle = 105°; WFS = 4.1 pixels; and scan time = 1:18 min. The eye tumor, indicated by the white cross, is visible as well as retinal detachment, pointed out by the white circle in the subretinal fluid. The high resolution parameter maps show much lower T1, T2, and M0 values in the tumor compared with the vitreous body, while the subretinal fluid can also be distinguished from the tumor by slightly higher T1, T2, and M0 values. B, Signal evolutions are shown in blue together with the matched dictionary element in red, for the retina (white circle), the lens nucleus, the eye tumor (white cross) and the fat