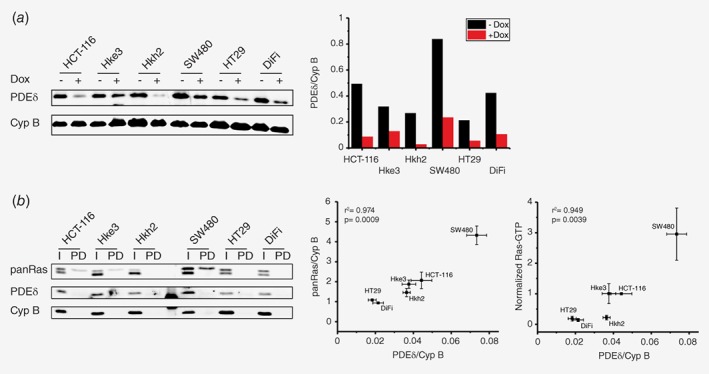
Figure 1.

PDEδ and Ras levels in colorectal cancer cell lines. (a) Left: PDEδ protein level of distinct colorectal cancer cell lines in absence or presence of PDEδ shRNA induced by doxycycline after 72 h determined by western blot analysis. Cyclophilin B was used as loading control. Right bar graph: quantification of endogenous PDEδ levels of each cell line with (red) and without (black) doxycycline induction. (b) Left: PDEδ and panRas protein level (I) and Ras‐GTP level (PD) of distinct CRC cell lines determined by western blot analysis. Cells were serum‐starved 24 h before lysis and active Ras was enriched by 3xRaf‐RBD pull‐down. Middle and right: Correlation plots of PDEδ and panRas expression ± s.e.m of four biological replicates as well as PDEδ and active Ras levels ± s.e.m of four biological replicates (normalized to HCT‐116 data). Pearson's correlation analysis shows a high correlation of 0.974 and 0.949 between the respective expression levels. [Color figure can be viewed at wileyonlinelibrary.com]
