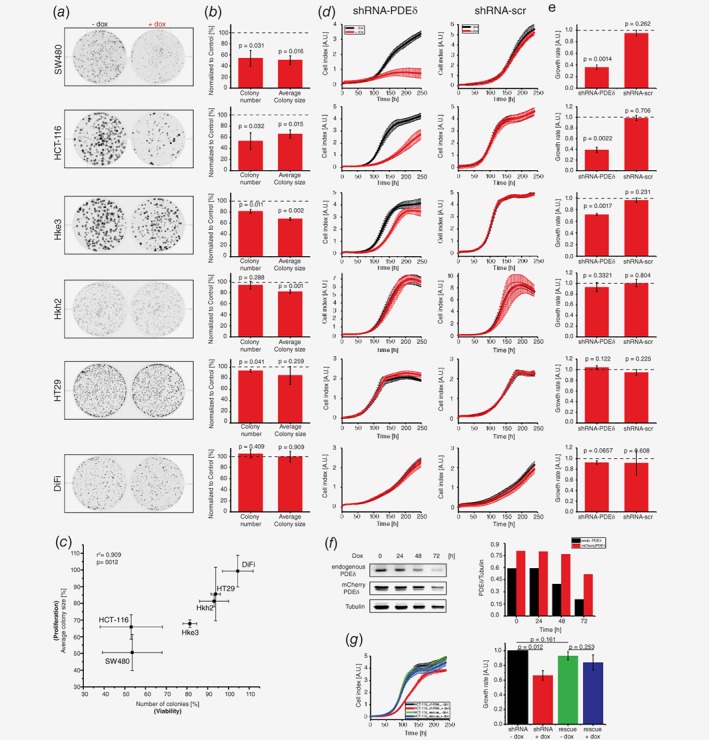
Figure 2.

PDEδ knock down suppresses proliferation and survival of colorectal cancer cell lines harboring oncogenic KRas mutations. (a) Representative example out of three independent clonogenic assay experiments for the cell lines indicated. Cells were grown for ten days in the presence (+dox) or absence (−dox) of doxycycline. (b) Quantification of colony number ± s.d. and average colony size ± s.d. of three independent experiments. Knock down wells were normalized to the respective untreated control (dashed line). Significance was calculated using one sample t test. (c) Correlation plot of colony number ± s.d. vs. average colony size ± s.d. relative to respective control conditions under PDEδ knock down as determined in (b). Pearson's correlation analysis shows a correlation of 0.909. (d) Representative RTCA profiles out of three independent experiments for shRNA against PDEδ or nontargeting (scr) shRNA. Cell indices ± s.d. of four replicates were measured in the presence (red) or absence (black) of doxycycline. Doxycycline was added at the beginning of the measurement. (e) Growth rates ± s.d. of doxycycline‐induced shRNA‐PDEδ or scrambled shRNA expression of three independent experiments. Growth rates were calculated by the area under RTCA curve over 240 h and normalized to the respective untreated condition (dashed line). Significance was calculated using one sample t test. (f) Left: endogenous PDEδ and rescue mCherry‐PDEδ protein level in HCT‐116 after increasing periods of doxycycline administration determined by western blot. Tubulin was used as loading control. Right bar graph: quantification of endogenous PDEδ (black) and mCherry‐PDEδ (red) levels after different administration periods. (g) Left: Representative RTCA profile out of three independent experiments for HCT‐116 shRNA PDEδ (black, red) and HCT‐116 shRNA PDEδ stably expressing a rescue mCherry‐PDEδ construct (blue, green). Cell indices ± s.d. of four replicates were measured in the presence (red, blue) or absence (black, green) of doxycycline. Doxycycline was added at the beginning of the measurement. Right: Growth rates ± s.d. (n = 3) of doxycycline‐induced shRNA‐PDEδ in HCT‐116 with and without mCherry‐PDEδ rescue construct expression. Growth rates were calculated by the area under RTCA curve over 240 h and normalized to the untreated control (black). Significance was calculated using student's t test.
