
Figure 2.
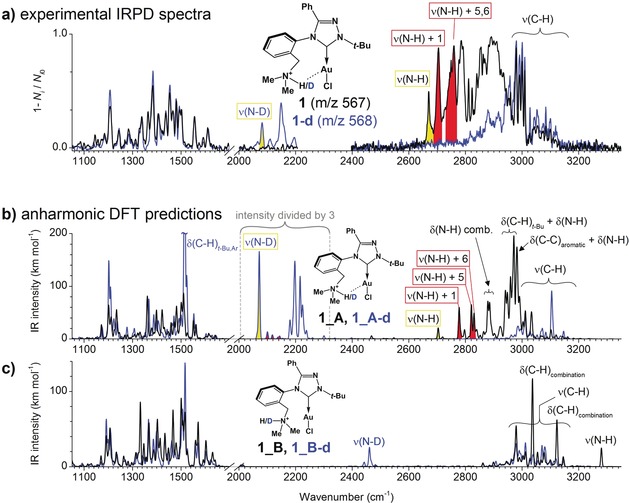
a) Experimental helium‐tagging IRPD spectra of the mass‐selected protonated complex 1 and its deuterated analog 1‐d. b),c) Calculated (B3LYP‐D3/6‐31G*/Au:def2‐SVP) anharmonic vibrational spectra of b) 1_A and c) 1_B and their deuterated analogues (1_A‐d, 1_B‐d). The displacement vectors of selected bands are shown in Figure 3.