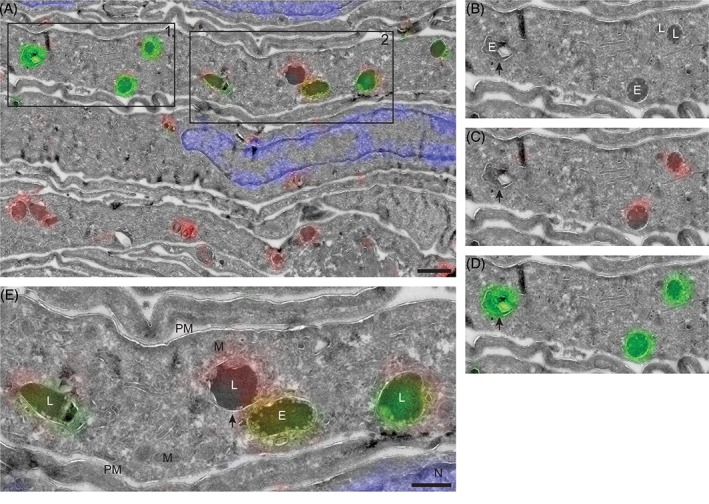
Figure 6.

hrGBA is delivered to GBA‐containing lysosomes in NHDFs as determined by CLEM. A‐E, Overlay of electron micrograph and confocal fluorescence image of an ultrathin cryosection of NHDFs expressing the Man‐R. The cells were allowed to take up MDW933‐labeled hrGBA (green) for 6 hours, while endogenous GBA was labeled by adding MDW941 to the culture medium at a concentration of 5 nM for 2 hours (red). Nuclei were stained with DAPI (blue). Scale bar in A, 1 μm. B‐D, Magnification of boxed area 1 from A. E, endosome; L, lysosome. The arrow indicates an endosome that contains endocytosed hrGBA (green). E, Magnification of boxed area 2 from A showing lysosomes with both endocytosed hrGBA (green) and endogenous GBA (red). One lysosome (arrow) contains mainly the endogenous enzyme. M, mitochondrion; PM, plasma membrane. Scale bar, 500 nm
