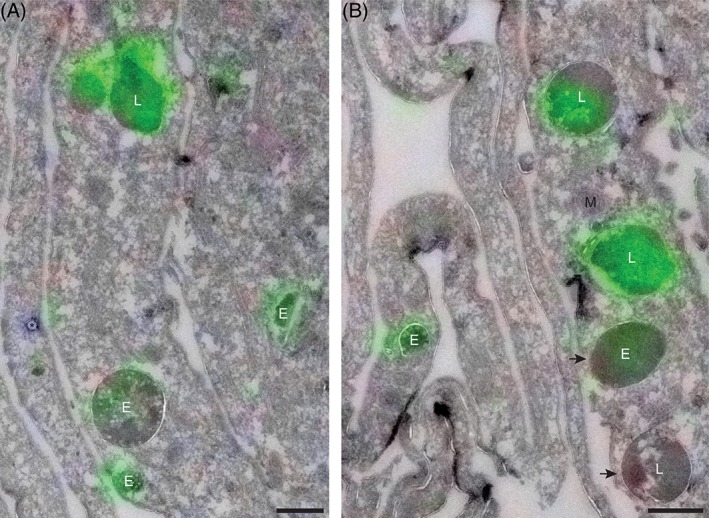
Figure 7.

hrGBA is delivered to lysosomes in LIMP II−/− fibroblasts as determined by CLEM. A, B, Overlay of electron micrograph and confocal fluorescent image of an ultrathin cryosection showing LIMP II−/− fibroblasts + Man‐R, after a 6 hours‐uptake of MDW933‐labeled hrGBA (green) and in situ labeling of endogenous GBA (red, not detected). Nuclei were stained with DAPI (blue). Both endosomes (E) and lysosomes (L) are positive for hrGBA, however, not all of them are reached (arrows). M, mitochondrion; *, bead used for correlation. Scale bars, 500 nm
