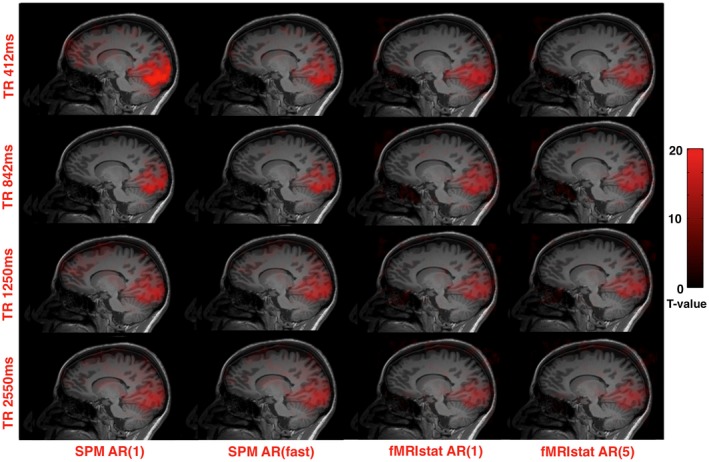
Figure 2.

Activation in the visual cortex is illustrated in 1 subject at a threshold of 20 overlaid on their T1 volume. Each image shows the same sagittal slice through the global maximum location. Each panel represents analysis of the same data using different autoregressive models (left to right) and TR (top to bottom)
