
Figure 4.
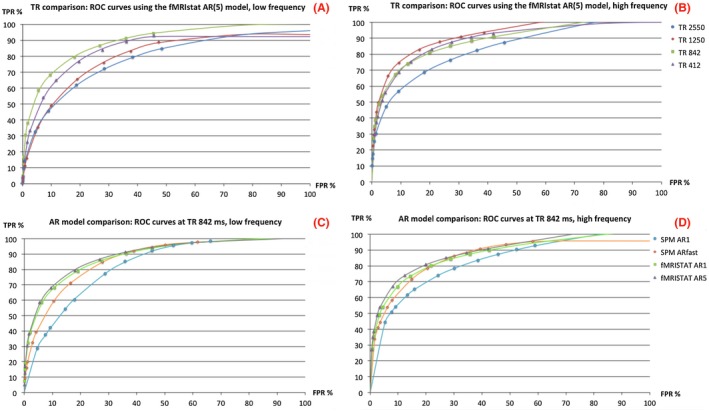
ROC curves for each TR for the lowest (A) and highest (B) rate of presentation obtained with conservative autocorrelation estimates (fMRIstat AR5). ROC curves were also calculated for each autoregressive model at a TR of 842 ms for the lowest (C) and highest (D) rate of presentation. All ROC curves were produced using a group level mask (P < 0.001, 20 voxels) to determine true/false positives