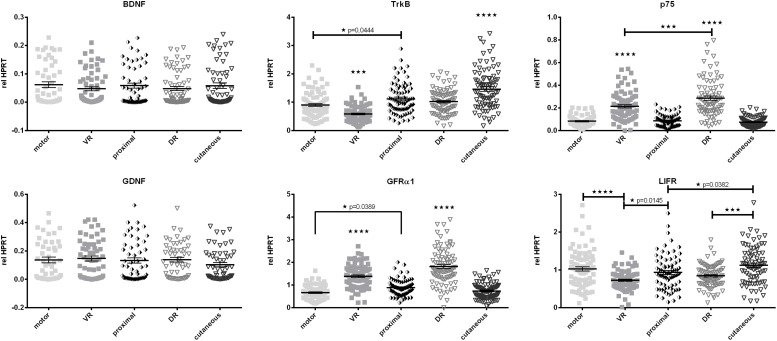
FIGURE 5.
Comparison of baseline mRNA expression of neurotrophic factors and their receptors relative to HPRT in Schwann cellsof the femoral nerve constituents. In contrast to BDNF and GDNF, expression levels of neurotrophic factor receptors display significant discrepancies along the central-peripheral axis. motor, femoral nerve motor branch; cutaneous, femoral nerve cutaneous branch; proximal, mixed femoral nerve segment proximal to bifurcation; VR, ventral root; DR, dorsal root. Data are presented as mean ± SEM, n ≥ 57, One-way analysis of variances (ANOVA) with Tukey’s multiple comparison. (*p < 0.05, ∗∗∗p < 0.001, p < 0.0001).

