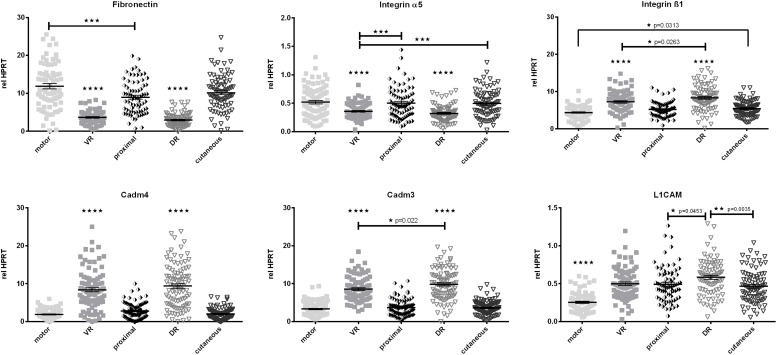
FIGURE 6.
Quantification of baseline expression of cell adhesion molecules along the central-peripheral axis in healthy nerves. A strong spatial influence on expression of cell adhesion molecules was measured. Additionally the L1CAM mRNA levels in the femoral motor branch were significantly lower than in the central, proximal and cutaneous nerve segments. motor, femoral nerve motor branch; cutaneous, femoral nerve cutaneous branch; proximal, mixed femoral nerve segment proximal to bifurctaion; VR, ventral root; DR, dorsal root. Data are presented as mean ± SEM, n ≥ 57, One-way analysis of variances (ANOVA) with Tukey’s multiple comparison. (*p < 0.05, ∗∗p < 0.01, ∗∗∗p < 0.001, p < 0.0001).

