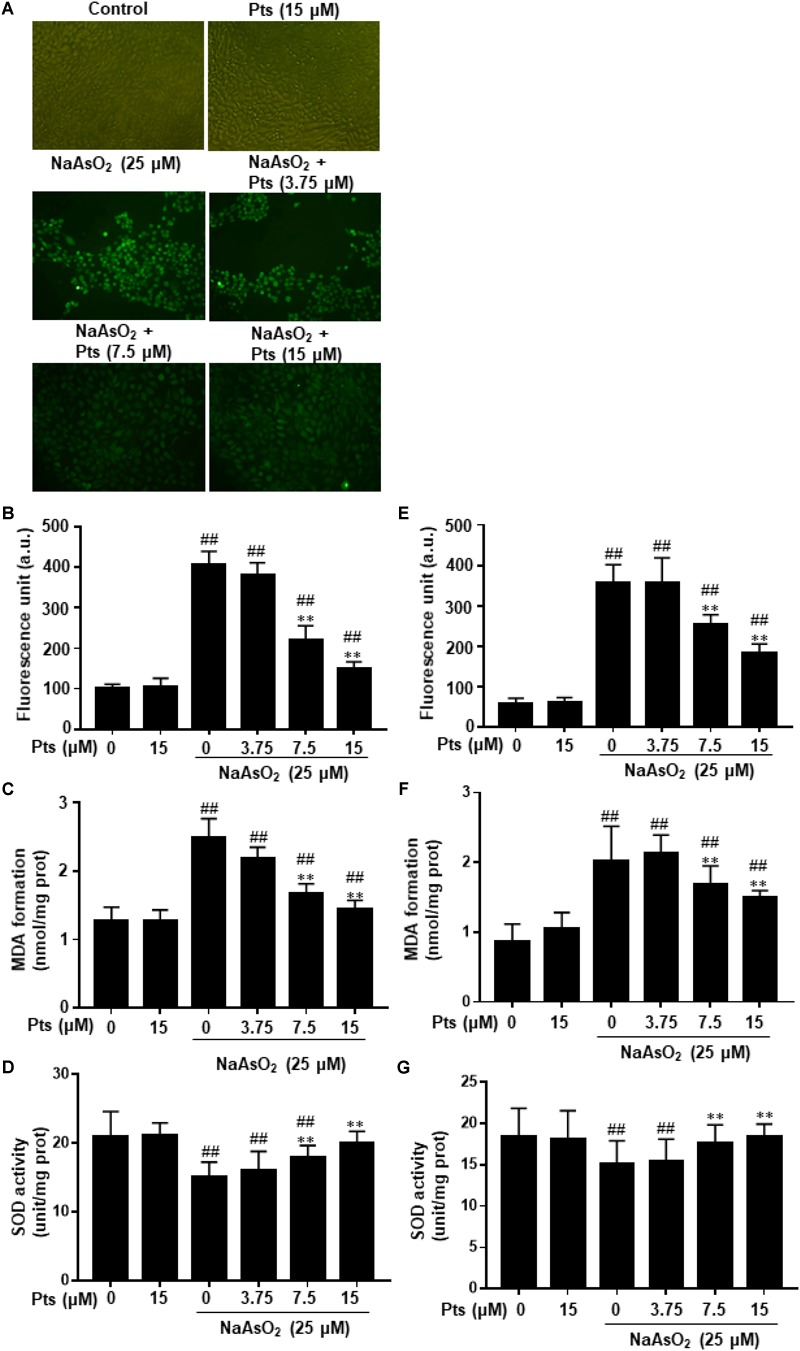
FIGURE 2.

Protective effect of Pts pretreatment against NaAsO2-induced oxidative stress in HaCaT cells. The HaCaT and JB6 cells were exposed to 25 μM of NaAsO2 for 24 h with or without Pts (3.75, 7.5, and 15 μM) pretreatment. (A,B,E) ROS generation was measured by the DCFH-DA method using a multi-detection reader and fluorescence microscope at 100× magnification. Intracellular MDA levels (C,F) and SOD (D,G) activities were determined by commercial kits. The results are expressed as the means ± S.E.M. of three independent experiments. ##P ≤ 0.01 versus the control group, ∗∗P ≤ 0.01 versus the NaAsO2 group.
