
FIGURE 4.
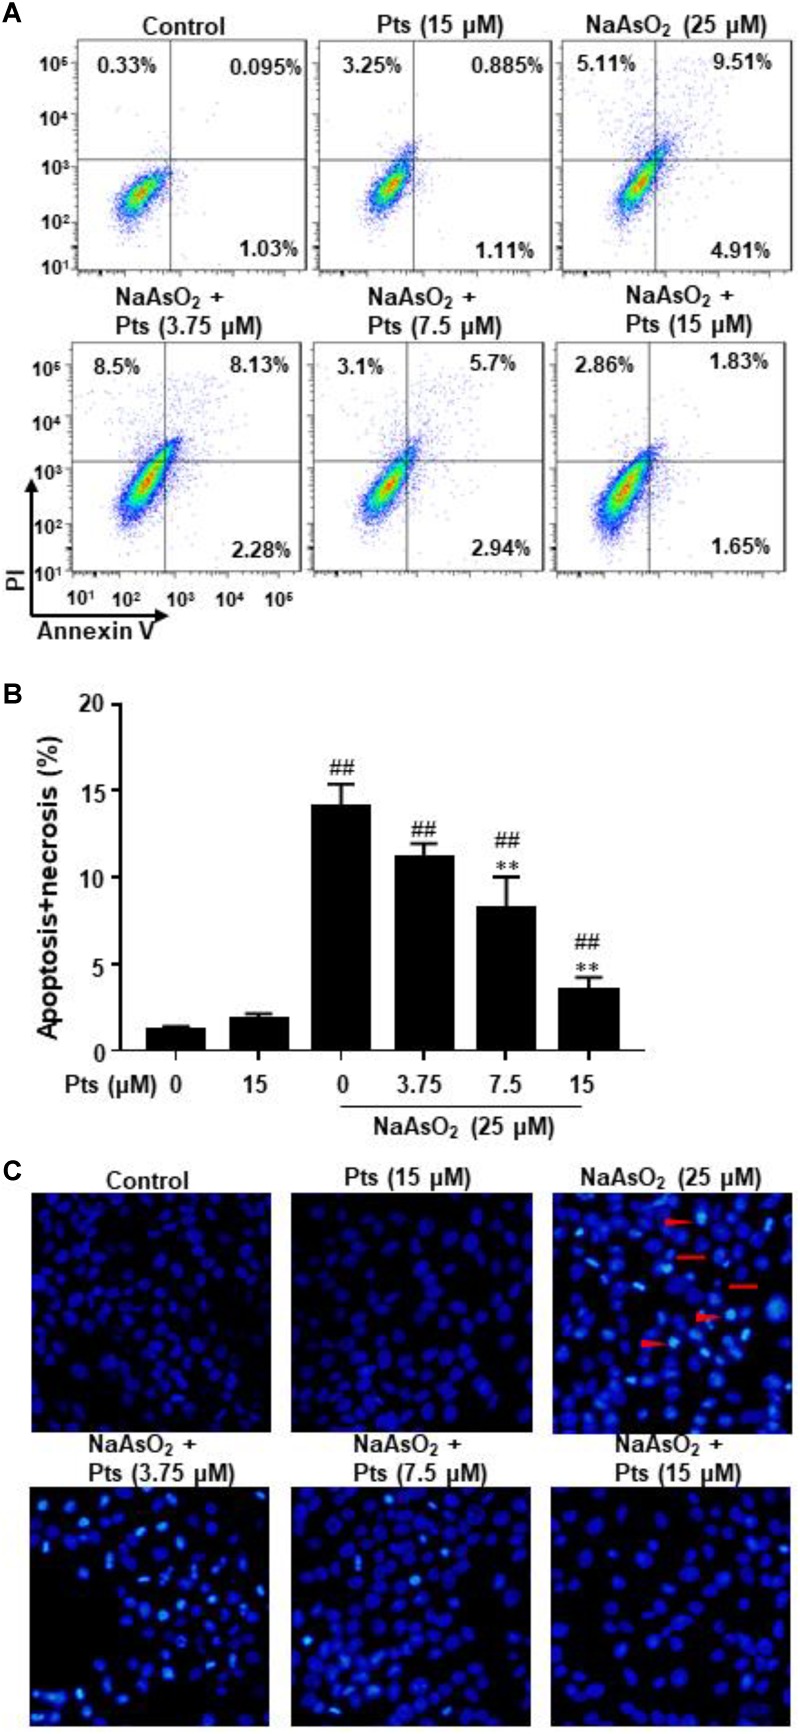
Protective effect of Pts pretreatment against NaAsO2-induced apoptosis in HaCaT cells. The HaCaT cells were exposed to 25 μM of NaAsO2 for 24 h with or without Pts (3.75, 7.5, and 15 μM) pretreatment. (A,B) The percentage of cell apoptosis was determined using flow cytometry. (C) Morphology of apoptotic cells was evaluated by fluorescence microscopy following DAPI staining at 200× magnification. Triangles: nuclear chromatin condensation in apoptotic cells. Arrows: apoptotic bodies. The results are expressed as the means ± S.E.M. of three independent experiments.##P ≤ 0.01 versus the control group, ∗∗P ≤ 0.01 versus the NaAsO2 group.