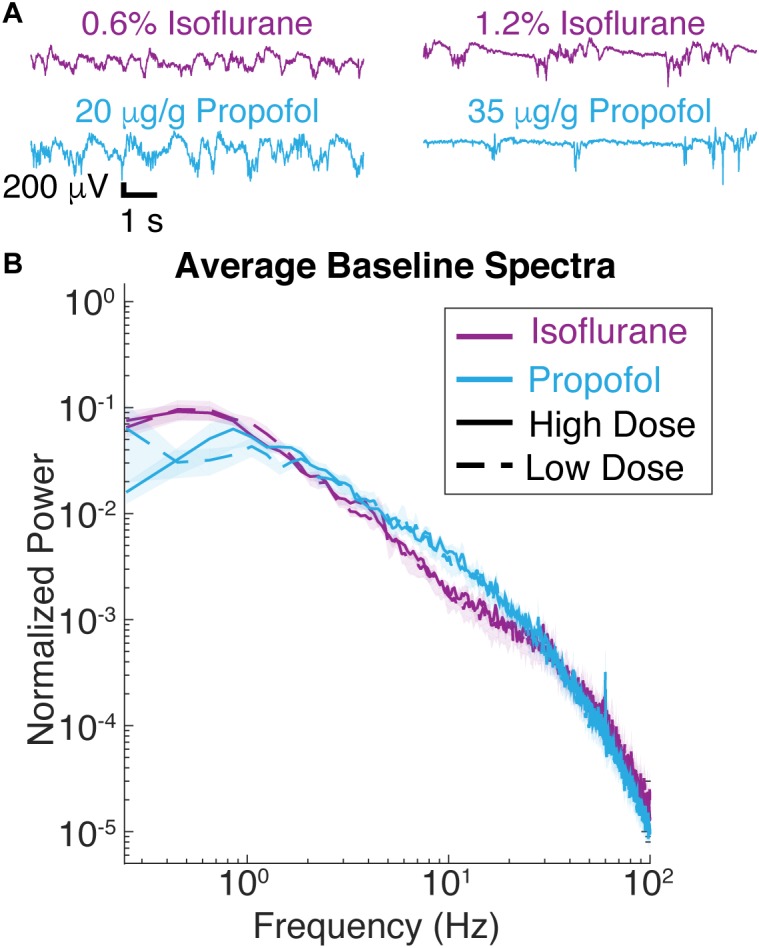
FIGURE 2.

Spontaneous LFP of mice under isoflurane and propofol have similar spectral characteristics. (A) Ten seconds of unstimulated local field potential (LFP) recorded in V1 under high dose isoflurane (1.2%), low dose isoflurane (0.6%), high dose propofol (35 μg/g brain), low dose propofol (20 μg/g brain). (B) Power spectra of 1 min of unstimulated LFP from V1 were computed for all seven animals. Blue curves are from animals under propofol, while purple traces are from animals under isoflurane. Solid lines denote high drug concentrations while dashed denote low drug concentrations. Shading represents the 95% confidence intervals for each condition.
