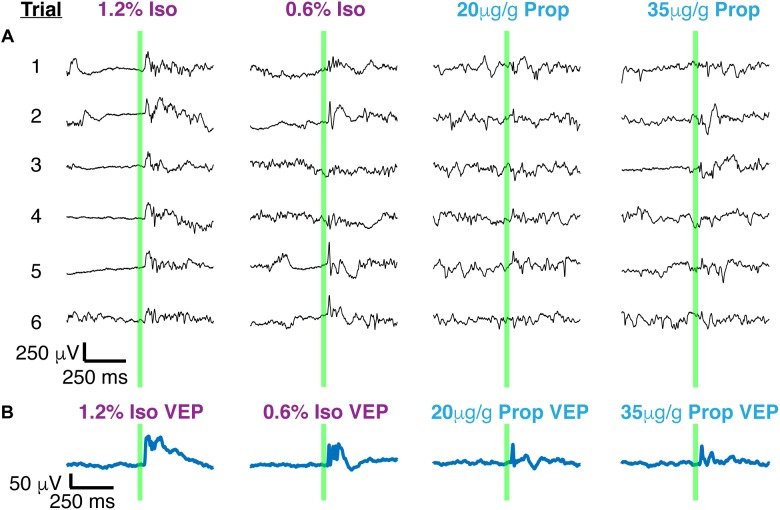
FIGURE 4.
Single trials of visual evoked potentials under isoflurane and propofol both have high trial by trial variability. (A) Six out of 100 randomly chosen individual flash evoked potentials (thin black traces) under high and low doses of each anesthetic: isoflurane, propofol. (B) The average VEP over 100 trials for each anesthetic concentration. The flash is denoted by the green vertical line in both panels.

