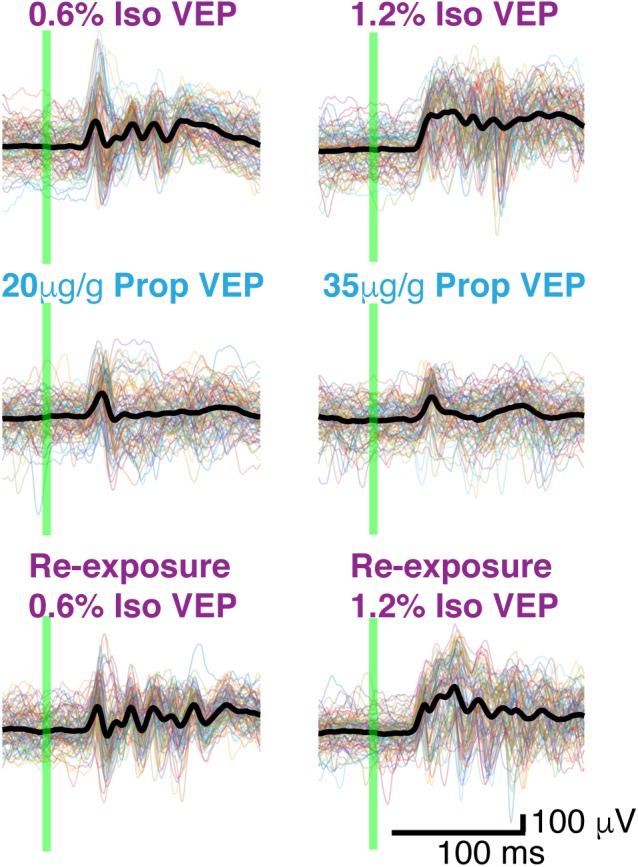
FIGURE 5.

Butterfly plots. Thin colored traces under high and low doses of each anesthetic: isoflurane, propofol, and isoflurane re-exposure in the same animal. Thick black lines represent the average VEP under each dose of each anesthetic. The flash is denoted by the green vertical line.
