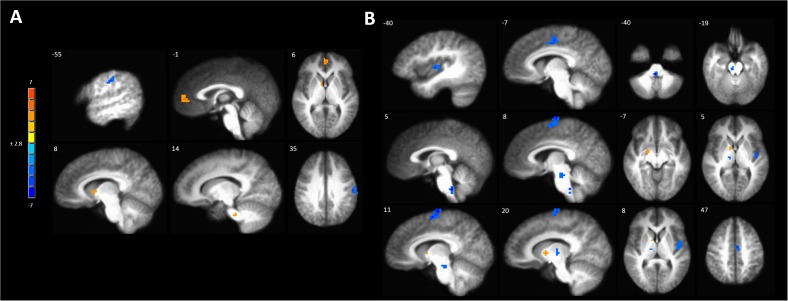
FIGURE 5.
Activations to painful mechanical stimuli in the hyperalgesic zone were modulated by tDCS. (A) Anodal compared to sham tDCS (red, anodal > sham, blue sham > anodal); (B) Cathodal compared to sham tDCS (red, cathodal > sham, blue sham > cathodal). Maps are voxel-wise threshold of p ≤ 0.005, cluster extent corrected. Coordinates are according to the Talairach atlas.

