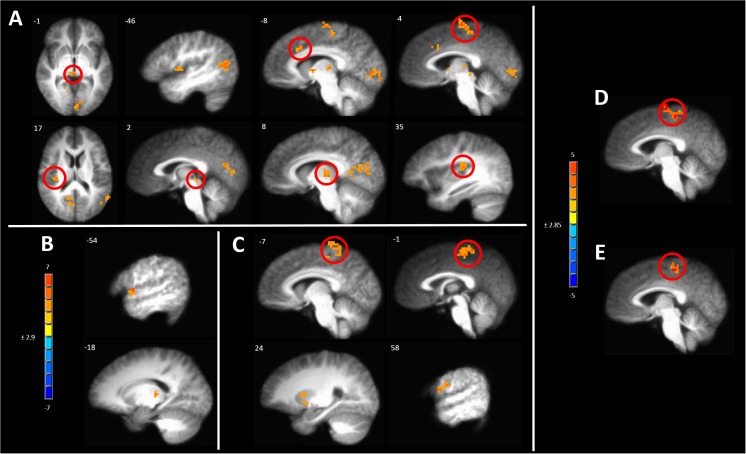
FIGURE 8.
Significant correlation of pain intensity with BOLD response evoked by painful mechanical stimuli after (A) sham, (B) anodal or (C) cathodal tDCS. (D) Conjunction analysis between the covariance maps of pain intensity with BOLD response in the pre-capsaicin condition following sham stimulation condition revealed coincident correlation in the paracentral lobule. (E) A similar analysis between the sham and cathodal stimulation conditions revealed coincident correlation only in the paracentral lobule. The resultant conjoint map of sham and anodal stimulation conditions revealed no such overlap. Maps are voxel-wise threshold of p ≤0.005, cluster extent corrected. Coordinates are according to the Talairach atlas.

