Figure 1.

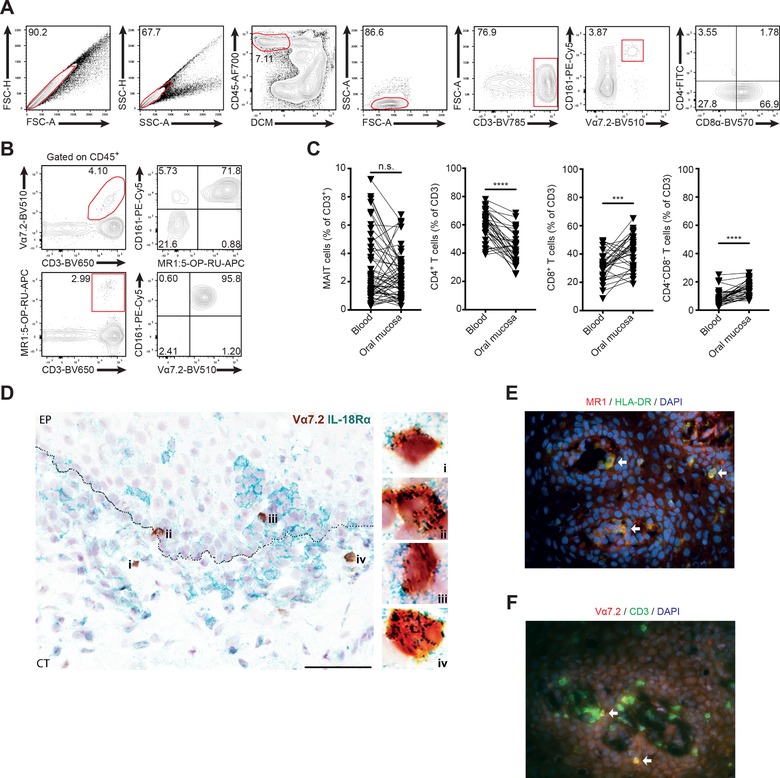
MAIT cells are part of the oral buccal mucosa T cell compartment. (A) Gating strategy to identify T cell populations in buccal mucosa by flow cytometry. (B) Representative staining of identification of MR1:5‐OP‐RU tetramer binding CD161+ MAIT cells within the CD3+Vα7.2+ buccal mucosal cell population (upper panels), and identification of CD161+Vα7.2+ MAIT cells within the MR1:5‐OP‐RU tetramer binding CD3+ buccal mucosal cell population (lower panels). (C) Comparison of T‐cell subset frequency in peripheral blood and buccal mucosa. All numbers given as percentage of CD3+ lymphocytes (n = 55 [MAIT], 32 [others]). (D) Location of MAIT cells within the buccal mucosa. Representative bright field image of buccal mucosal tissue section, from a healthy donor, stained for Vα7.2 in brown (DAB) and IL‐18Rα in green (Vina Green) showing that the MAIT cells are localized close to the basement membrane (n = 6). The images on the right, collected with a 100× objective, are magnified view of the region indicated in the box in the image to the left, collected with a 40× objective. The scale bar represents 60 μm, image including epithelium (EP) and connective tissue (CT). Representative immunofluorescence images of buccal mucosal tissue sections, from a healthy individual, stained for (E) MR1 (red) and HLA‐DR (green) and stained for (F) Vα7.2 (red) and CD3 (green). Double‐positive cells appear as yellow, arrows point to double‐positive cells for each marker combination. DAPI (blue) was used as a counterstain for visualization of cell nuclei. The images were collected with 40× objective. For each panel, "n" indicates the number of individual human donors tested for each dataset. Statistical significance determined using Wilcoxon matched pairs test for paired data. ***p <0.001, ****p <0.0001.
