
Figure 2.
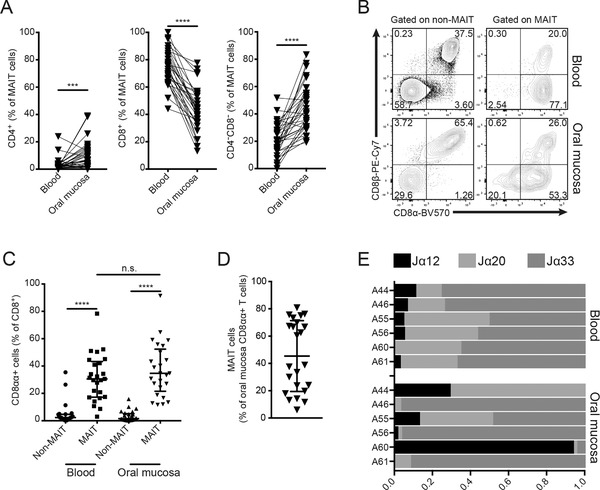
Co‐receptor and TCR‐Jα usage differences between blood and buccal mucosal MAIT cells. (A) Representation of MAIT cell subsets defined by CD4+ and CD8+ expression. All numbers given as percentage of Vα7.2+CD161+ cells (n = 32). (B) Representative flow cytometric plots of CD8α and CD8β expression in T cell subsets in blood and mucosa. (C) Comparison of CD8αα expression in CD8+ T cell subsets in blood and mucosa. All numbers given as percentage of CD8+ cells (n = 25). (D) Percentage MAIT cells among the mucosa CD8αα+ T‐cell population (n = 23). In C and D, medians and interquartile ranges are indicated. (E) MAIT cell TCR Jα segment usage in paired blood and mucosal samples from healthy donors (n = 6). For each panel, "n" indicates the number of individual human donors tested. Statistical significance determined using Wilcoxon matched pairs test for paired data. ***p <0.001, ****p <0.0001.