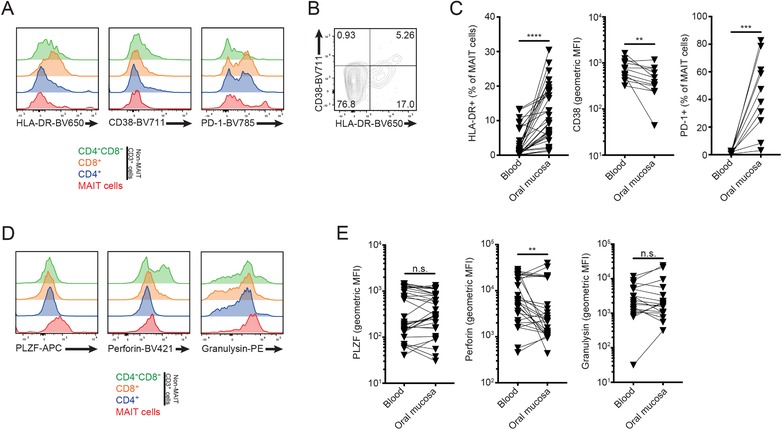
Figure 3.

Buccal mucosal MAIT cells express PLZF and exhibit an activated PD‐1+ phenotype. (A) Representative histograms of HLA‐DR and CD38 expression in oral buccal mucosa T cell subsets. (B) Representative FACS plot of CD38 and HLA‐DR coexpression in buccal MAIT cells. (C) Expression of HLA‐DR (n = 34), CD38 (n = 12), and PD‐1 (n = 12) in blood and mucosal MAIT cells, as percentage of or mean fluorescence intensity (MFI) in Vα7.2+CD161+ cells. (D) Intracellular staining histograms of PLZF, perforin and granulysin in buccal T cell subsets. (E) Expression levels of PLZF (n = 32), perforin (n = 29), and granulysin (n = 17) in blood and oral mucosal MAIT cells, as MFI in Vα7.2+CD161+ cells. For each panel, "n" indicates the number of individual human donors tested. Statistical significance determined using Wilcoxon matched pairs test for paired data. **p< 0.01, ***p< 0.001, ****p< 0.0001.
