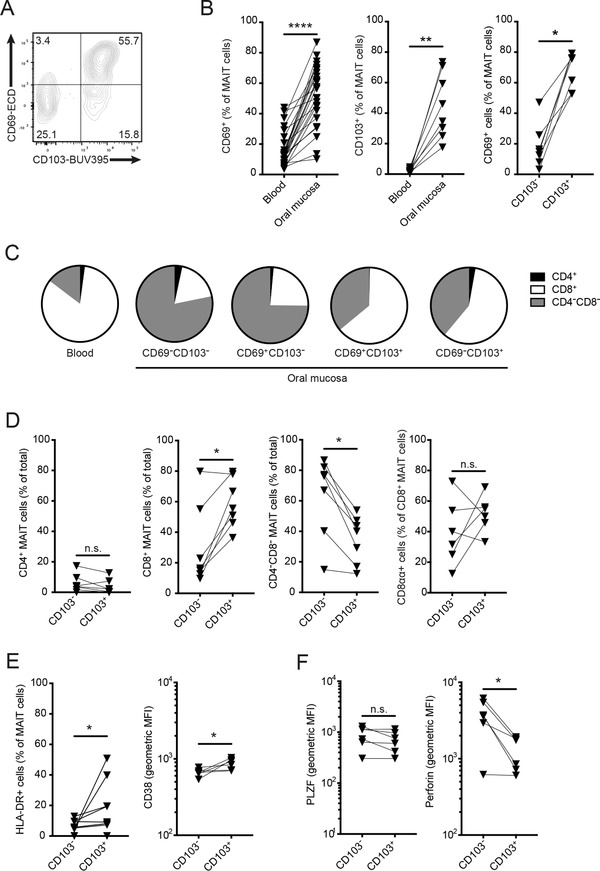
Figure 4.

Tissue resident and nonresident MAIT cells in buccal mucosa. (A) Representative plot of CD69 and CD103 expression in buccal MAIT cells. (B) Expression of CD69 (n = 25) and CD103 (n = 8) in blood and mucosal MAIT cells, and expression of CD69 in mucosal CD103+ and CD103– MAIT cells (n = 7). (C) Expression of CD4+ and CD8+ in blood MAIT cells, and subsets of buccal MAIT cells defined by CD69 and CD103. Proportion of each marker given as median value (n = 6). (D) CD4+ and CD8+ expression profile in mucosal CD103+ and CD103– MAIT cells (n = 7). (E) Expression of HLA‐DR (n = 8) and CD38 (n = 6) in mucosal CD103+ and CD103– MAIT cells. (F) Expression of PLZF and perforin in mucosal CD103+ and CD103– MAIT cells (n = 6). For each panel, "n" indicates the number of individual human donors tested. Statistical significance determined using Wilcoxon matched pairs test for paired data. *p <0.05, **p <0.01, ****p< 0.0001.
