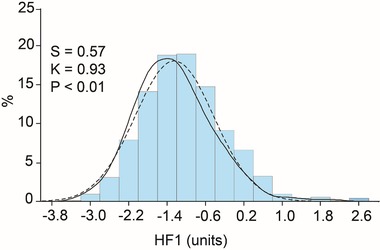
Figure 1.

Distribution of the multidimensional urinary biomarker HF1 in 745 participants enrolled in the Flemish Study on Environment, Genes and Health Outcomes. The curves represent the fitted normal (full line) and kernel (dashed line) density plots. S and K are the coefficients of skewness and kurtosis, respectively. The p‐value is for the Kolmogorov–Smirnov test and indicates departure from normality.
