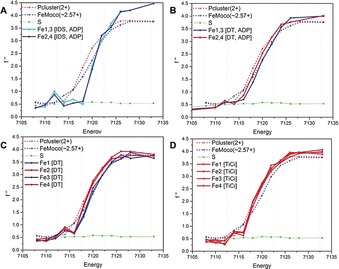
Figure 2.

SpReAD curves for the three possible oxidation states of the Fe‐protein: A) The IDS‐oxidized [4Fe:4S]2+ state with ADP. B) The dithionite (DT)‐reduced [4Fe:4S]1+ state with ADP. C) The dithionite‐reduced [4Fe:4S]1+ state (nucleotide free). D) The TiIII‐citrate‐reduced [4Fe:4S]0 state (nucleotide free). The structures used for the data depicted in panels A and B contain a crystallographic two‐fold axis of symmetry through the cluster and so Fe1 and Fe3 are equivalent, as are Fe2 and Fe4. The structures used for the data depicted in panels C and D contain an entire [4Fe:4S] cluster in the asymmetric unit, and so the absorption curves for each Fe are presented. More‐reduced profiles are coded in red, more‐oxidized profiles are coded in blue. For reference, the SpReAD profiles of the dithionite‐reduced state of the MoFe‐protein metalloclusters are plotted: the average Fe curve for the all‐ferrous P‐cluster (red dots) and the more oxidized average of all Fe in FeMoco (ca. Fe2.57+) (blue dots). The sulphur anomalous (green) is also shown; at 7100 eV, the expected value of f′′ is 0.70 e (skuld.bmsc.washington.edu/scatter/data/S.dat).
