Figure 3.

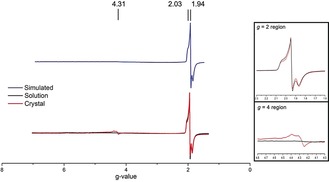
EPR spectra of Fe‐protein in the [4Fe4S]1+ state in solution (black) and in a crystal slurry (red). Simulated spectrum in blue. Inserts show the expanded g=2 and g=4 regions.

EPR spectra of Fe‐protein in the [4Fe4S]1+ state in solution (black) and in a crystal slurry (red). Simulated spectrum in blue. Inserts show the expanded g=2 and g=4 regions.