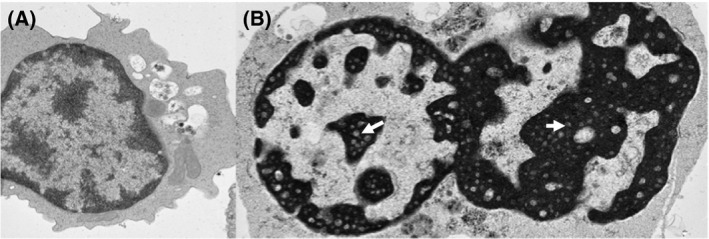
Figure 3.

(A) Electron microscopy of a normal cultured erythroblast (day 7 of culture) showing the expected pattern of euchromatin and heterochromatin (magnification × 4000). (B) A CDA‐I cultured erythroblast showing binuclearity and the ‘Swiss cheese’ or ‘spongy’ heterochromatin with electron‐lucent areas (arrows) that is pathognomonic of this condition.
