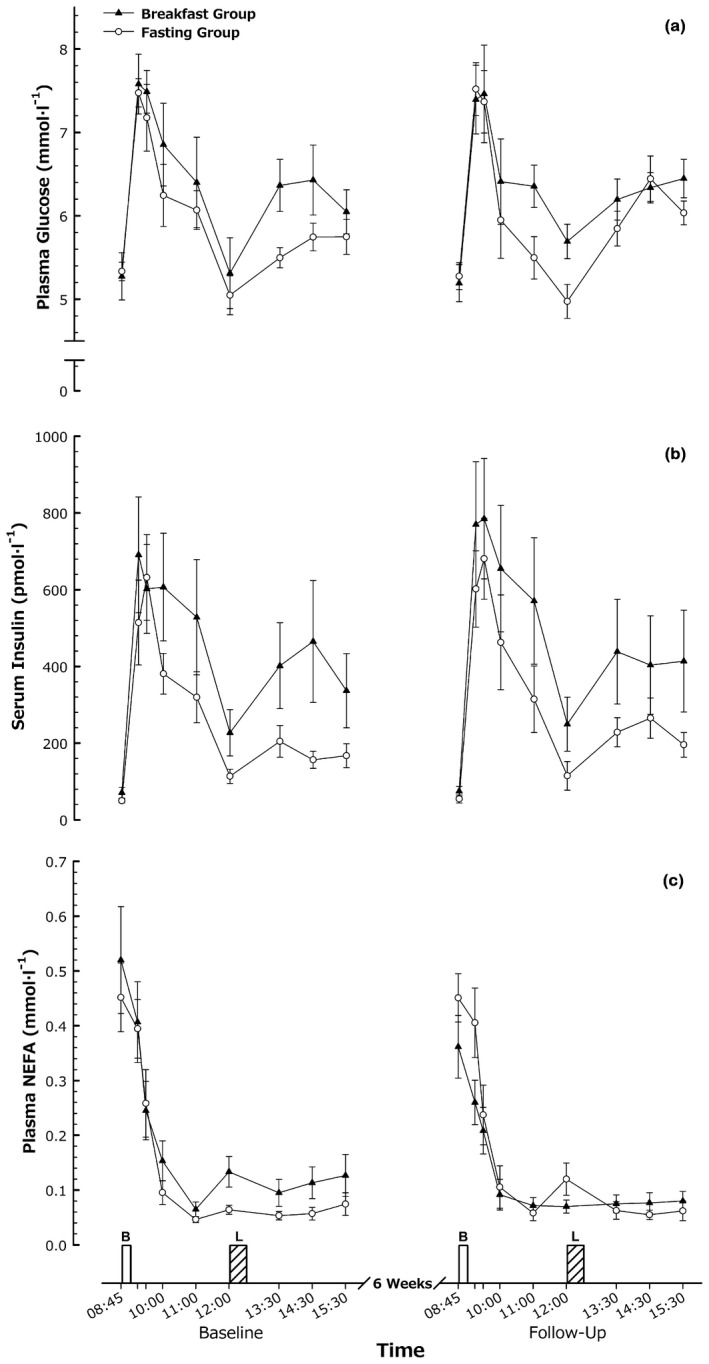
Figure 3.

Metabolic responses. (A) Plasma glucose, (B) serum insulin, and (C) plasma nonesterified fatty acid (NEFA) responses to feeding in men and women with obesity before and after a 6‐week intervention. Values are mean ± SEM. B, breakfast; L, ad libitum lunch.
