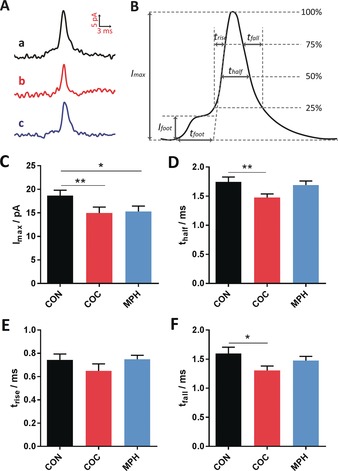
Figure 3.

A) Average peaks obtained from single‐cell amperometry: a) control, b) COC, and c) MPH. B) Scheme showing the different parameters used for the peak analysis for exocytosis. Comparisons of C) peak current, I max; D) half peak width, t half; E) 25–75 % rise time, t rise; and F) fall time, t fall, from single‐cell amperometry; control (22 cells), COC (23 cells), MPH (17 cells). Error=SEM. *: p<0.05; **: p<0.01.
