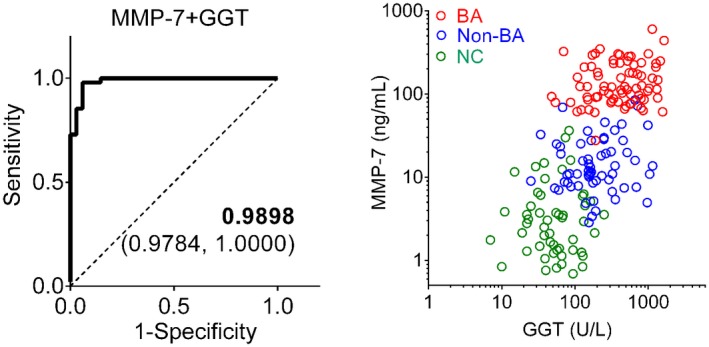
Figure 5.

Performance of combined MMP‐7 and GGT in identifying subjects with BA. (A) AUC for combined MMP‐7 and GGT in differentiating BA from non‐BA in logistic regression analysis. The AUC value is shown with the 95% CI. (B) MMP‐7 plotted against GGT for each subject in BA (red), non‐BA (blue), and NC (green).
